Deel vs Gusto 2026: Which HR & Payroll Platform is Right for Your Business?
Deel vs Gusto 2026: Which HR & Payroll Platform is Right for Your Business?
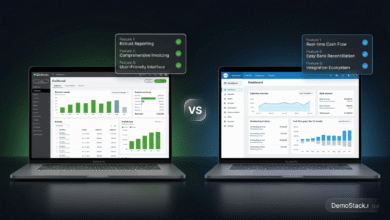
Both platforms appear on every “best payroll software” list. Both handle payroll, HR, and compliance. But they were built to solve fundamentally different problems — and choosing the wrong one means either overpaying for features you’ll never use, or outgrowing your platform the moment you hire your first international employee. Here’s the complete, honest comparison.
Why Deel vs Gusto Is the Wrong Question — Until You Ask It Right
The Deel vs Gusto comparison is one of the most searched HR software questions of 2026 — and one of the most misunderstood. At first glance, these two platforms look similar: both handle payroll, both deal with taxes and compliance, both offer HR tools, and both appear in the same roundups and recommendation lists. The temptation is to compare them feature-by-feature and pick the one with the better score. That approach misses the point entirely.
Gusto and Deel were built to solve fundamentally different problems. Gusto was built for US small businesses that need to run domestic payroll efficiently, compliantly, and affordably. Deel was built for companies that need to hire, pay, and manage workers across international borders without setting up legal entities in every country. These are different businesses, different use cases, and different value propositions — comparing them directly is like comparing a city car to a 4×4 truck. Both are vehicles; which one you need depends entirely on where you’re driving.
This comparison cuts through the noise to give you a clear, honest assessment of both platforms — what each genuinely excels at, where each falls short, how their pricing compares for different team compositions, and exactly which business situations call for each platform. By the end, you’ll have a definitive answer for your specific situation rather than a vague “it depends.”
Gusto and Deel: Who Built Them and Why
Gusto — Built for US Small Business Payroll
Founded in 2011 in San Francisco, Gusto was built around a single insight: running payroll for small US businesses was unnecessarily complicated, error-prone, and stressful. The founders set out to make payroll genuinely simple — automating taxes, building in benefits administration, and creating an interface that any business owner could use without accounting expertise. Over 300,000 US businesses now use Gusto, making it the most widely used payroll platform in the US small business market. It is US-only for W-2 employee payroll, though it can pay international contractors in 120+ countries.
Deel — Built for Global Workforce Management
Founded in 2019 in San Francisco, Deel was built to solve a problem that Gusto and most legacy HR platforms couldn’t: how do you legally hire and pay a full-time employee in Germany, Brazil, or Singapore without setting up a legal entity in each country? Deel’s answer was the Employer of Record model — Deel acts as the legal employer in 150+ countries through its own network of local entities, handling employment contracts, local tax withholding, social contributions, and benefits. With 35,000+ customers, $1B+ ARR, and 1 million+ active contracts managed, Deel has become the global HR infrastructure layer for remote-first companies worldwide.
The Core Difference: Geography First, Features Second
Before comparing any specific feature, understand the fundamental strategic difference between these two platforms. This single distinction should drive 80% of your decision:
The Geographic Decision Framework
If your team is mostly in the United States for the next 12–24 months → Start with Gusto. It is simpler, cheaper, and purpose-built for exactly what you need. Switching to a more complex global platform later is manageable when you actually need it.
If you already hire internationally, or plan to within 12 months → Start with Deel. Switching from Gusto to Deel after you’ve already begun international hiring is painful and disruptive. If global hiring is on your near-term roadmap, build on the right infrastructure from the start.
Feature-by-Feature Comparison
💸 Payroll Processing
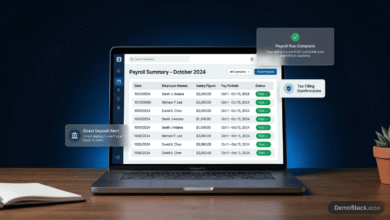
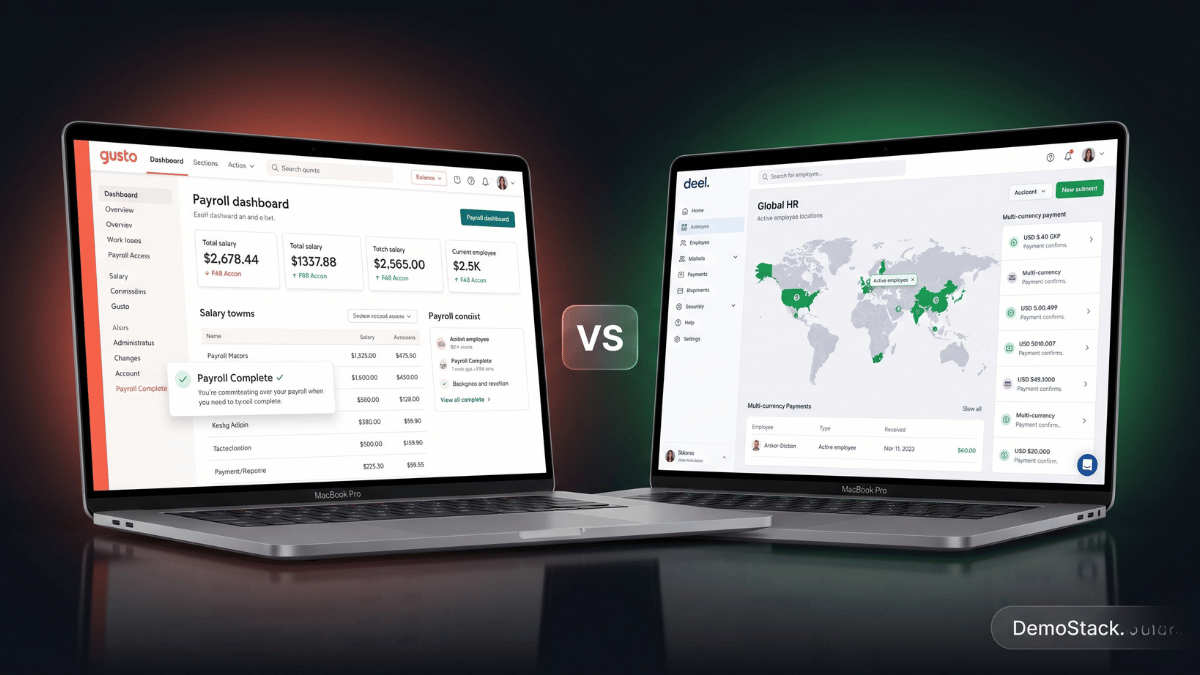
Gusto is the gold standard for US payroll. It calculates federal, state, and local taxes automatically, files all payroll tax forms on your behalf, generates W-2s and 1099s at year end, and supports unlimited pay runs with same-day or next-day direct deposit. The AutoPilot feature runs recurring payroll automatically without any manual input — customers report completing payroll in under 11 minutes on average. Multi-state payroll (employees in different US states) is supported on the Plus plan. The integration with QuickBooks and Xero keeps your books reconciled automatically. For US payroll, Gusto is as good as it gets.
Deel handles payroll across 150+ countries simultaneously — calculating local taxes, social contributions, pension requirements, and mandatory benefits for each jurisdiction automatically. For a company with employees in the US, UK, Brazil, and Singapore all on the same payroll cycle, Deel manages the complexity that would require a separate local payroll provider in each country. Deel also processes payments in 150+ currencies with multiple withdrawal options including bank transfer, PayPal, Payoneer, and cryptocurrency. For US-only payroll, Deel’s pricing is non-transparent (requires a sales call) and generally more expensive than Gusto.
🏛️ Tax Compliance
Gusto handles US federal, state, and local tax filing with a strong accuracy guarantee. It files payroll taxes to the appropriate agencies on your behalf and is responsible for any penalties caused by its own filing errors. For US businesses, this is comprehensive coverage that eliminates the risk of manual tax filing mistakes — one of the most common and costly payroll errors for small businesses.
Deel handles international tax compliance across 150+ countries — each with its own employment law, tax rates, social contribution requirements, and mandatory benefits. Deel’s legal team continuously monitors regulatory changes in every country it operates in and updates contracts and payroll configurations automatically. This continuous compliance monitoring is genuinely difficult and expensive to replicate independently — it’s one of the core reasons companies pay Deel’s premium pricing.
🏥 Benefits Administration
Gusto is a licensed insurance broker — meaning you can offer health, dental, vision, life insurance, 401(k), HSA, and FSA directly through the Gusto platform, with premium deductions automatically synced to payroll. This is a significant advantage for small US businesses that want to offer competitive benefits without managing a separate broker relationship. The benefits administration experience in Gusto is genuinely excellent — it’s one of the most praised features among Gusto customers.
Deel has been rolling out its benefits administration app globally — US Payroll and EOR clients have access beginning in 2026, covering retirement, disability, and employee self-service. Global EOR clients receive locally appropriate benefits as part of the EOR service — Deel handles the local insurance, pension, and mandatory benefit requirements in each country as part of the employment package. The global benefits capabilities are strong; the US-specific benefits administration is newer and still maturing compared to Gusto’s established offering.
👤 HR Tools & Employee Management
Gusto includes a solid HR toolset on its higher-tier plans — digital onboarding with employee self-setup, document e-signing, offer letters, an applicant tracking system (ATS), custom employee handbooks, org charts, team directories, time tracking, PTO management, and the Gus AI assistant. The onboarding experience is particularly smooth — new hires set themselves up without HR intervention, entering their own banking and tax information directly into the platform.
Deel offers a free HRIS for up to 200 employees that covers org charts, document management, time off tracking, expense management, and performance reviews. The Deel AI assistant handles HR workflows and reporting. Deel also provides immigration and visa support in 70+ countries — a feature that has no equivalent in Gusto and is uniquely valuable for companies relocating talent internationally. IT asset management (provisioning and deprovisioning software and equipment for new hires) is also available through Deel IT.
📋 Contractor Management
Gusto supports contractor payments and 1099 generation for US contractors on all plans. For international contractors, Gusto can process payments in 120+ countries — but without localized contracts or compliance support, the legal risk of contractor classification remains with the business. This works fine for simple international contractor relationships but creates compliance exposure at scale.
Deel is the market leader for international contractor management. At $49/month per contractor, Deel provides locally compliant contractor agreements, automated invoice management, multi-currency payment processing, and continuous compliance monitoring for contractor classification risk. The Contractor of Record service ($325/month per contractor) provides additional classification protection for companies concerned about misclassification liability in key markets. For businesses with significant international contractor workforces, Deel’s compliance infrastructure is difficult to replicate independently.
Complete Side-by-Side Comparison
| Feature | Gusto | Deel | Winner |
|---|---|---|---|
| US Payroll | ✓ Best-in-class | Available (non-transparent pricing) | Gusto |
| Global Payroll | International contractors only (120+ countries) | ✓ 150+ countries, full compliance | Deel |
| Employer of Record | Via third-party partner (Remote) | ✓ Own entities, 150+ countries | Deel |
| US Benefits Brokerage | ✓ Native — health, 401k, HSA, FSA | Rolling out in 2026 (newer) | Gusto |
| US Tax Filing | ✓ All 50 states, guaranteed | Available | Gusto |
| International Tax Compliance | Limited — risk stays with business | ✓ Automated, 150+ countries | Deel |
| Contractor Management | US contractors strong, international basic | ✓ Globally compliant in 150+ countries | Deel |
| Ease of Use | ✓ Simpler — purpose-built for non-HR users | User-friendly but more complex | Gusto |
| HRIS Free Tier | Basic (paid plans) | ✓ Free up to 200 employees | Deel |
| Onboarding Experience | ✓ Best-in-class digital onboarding | Strong, especially for international hires | Gusto |
| Immigration Support | ✗ Not available | ✓ 70+ countries | Deel |
| Multi-Currency Payments | Limited | ✓ 150+ currencies | Deel |
| Pricing Transparency | ✓ Clear public pricing | Mixed — EOR/US payroll needs sales call | Gusto |
| Starting Price (US Payroll) | $49/mo + $6/person | Custom pricing (contact sales) | Gusto |
| G2 Rating | 4.5/5 | 4.6/5 | Deel (slightly) |
| Integrations | 195+ integrations | API-based, fewer native integrations | Gusto |
Pricing: Gusto vs Deel — What You’ll Actually Pay
Pricing is one of the clearest differentiators between these two platforms — and it reinforces the geographic decision framework. Gusto is significantly cheaper for US-only payroll. Deel’s pricing reflects the complexity and legal infrastructure of global employment.
Gusto Pricing 2026
Simple
$49/mo
+ $6/person/month
Full-service payroll, automated tax filing, employee self-service, basic HR tools. Single-state payroll.
Plus
$80/mo
+ $12/person/month
Everything in Simple + multi-state payroll, time tracking, next-day direct deposit, advanced HR tools, ATS.
Premium
Custom
Contact sales
Everything in Plus + dedicated support, HR resource center, compliance alerts, priority access to Gusto experts.
Contractor Only
$35/mo
+ $6/contractor/month
For businesses with only contractors — no W-2 employees. Contractor payments and 1099 generation.
Deel Pricing 2026
Free HRIS
$0/mo
Up to 200 employees
Full HRIS — org charts, documents, time off, expenses, performance reviews. No payroll processing included.
Contractors
$49/mo
per contractor
Locally compliant contracts, invoice management, multi-currency payments, compliance monitoring in 150+ countries.
Employer of Record
$599/mo
per employee
Hire full-time employees in 150+ countries without a local entity. Full local employment contracts, taxes, benefits, and compliance.
Global Payroll
$29/mo
per employee (own entity)
Run payroll through your own local entities. Deel handles the calculations and compliance — you remain the legal employer.
Real-World Cost Comparison: 10-Person US Team
Gusto Plus: $80 + (10 × $12) = $200/month — full payroll, multi-state compliance, benefits, HR tools, ATS.
Deel EOR (if hiring internationally): $599 × number of international employees. For 2 international employees: $1,198/month — plus separate US payroll costs.
For a US-only team, Gusto is dramatically more affordable. For companies with even a few international employees, Deel’s EOR pricing reflects the genuine legal and compliance value being delivered.
Honest Pros & Cons
✅ Gusto Pros
- Best-in-class US payroll — simple, fast, fully automated
- Native US benefits brokerage — health, dental, 401k, HSA/FSA
- Most user-friendly HR platform on the market
- Fully transparent, affordable pricing
- Excellent digital onboarding for new US hires
- Gus AI assistant for HR tasks
- 195+ integrations including QuickBooks, Xero, Slack
- AutoPilot for fully hands-off recurring payroll
- Trusted by 300,000+ US businesses
❌ Gusto Cons
- US-only for W-2 employee payroll
- International EOR uses a third-party partner (Remote)
- International contractor compliance risk stays with you
- Customer support response times can be slow
- Pricing scales with headcount
- Not the right choice once international hiring accelerates
✅ Deel Pros
- EOR in 150+ countries through own legal entities
- 250 owned entities — no third-party dependency
- Globally compliant contractor management in 150+ countries
- Immigration and visa support in 70+ countries
- Multi-currency payments in 150+ currencies
- Free HRIS for up to 200 employees
- Continuous compliance monitoring — updates automatically
- Deel IT for device and software management
- $1B+ ARR — financially stable, established platform
❌ Deel Cons
- EOR pricing ($599/employee/month) is expensive at scale
- US payroll pricing not transparent — requires sales call
- More complex platform — steeper learning curve
- US benefits administration still maturing (2026 rollout)
- Some billing and invoice errors reported in G2 reviews
- Customer support quality varies by region
- Fewer native integrations than Gusto (195 vs API-based)
Who Should Choose Gusto — and Who Should Choose Deel?
Choose Gusto if your team is US-based and staying that way
If all your employees are in the United States and you have no imminent plans to hire internationally, Gusto is the clear winner. It is simpler, cheaper, better integrated with US accounting tools, and has a more mature US benefits offering. For a 10-person US team, Gusto Plus costs $200/month — a fraction of what any international platform charges for equivalent domestic functionality. Our full Gusto review covers the complete platform in detail.
Choose Gusto if you’re a startup that needs to move fast on US hiring
For early-stage companies that need to hire US employees quickly — onboard them, set up payroll, offer benefits — Gusto is the fastest path from zero to operational. The self-service onboarding means new hires can set themselves up in under an hour. For companies racing to hire US talent, Gusto’s simplicity is a genuine competitive advantage over more complex platforms.
Choose Gusto if competitive US benefits are a priority
For US companies competing for talent who need to offer health insurance, dental, vision, 401k, HSA, and FSA as part of a competitive compensation package — Gusto’s native insurance brokerage is significantly easier to manage than any third-party benefits integration. Everything from benefits enrollment to premium deduction is handled within the same platform as payroll.
Choose Deel if you already have international employees
If you currently employ full-time workers outside the United States — regardless of whether they’re in 1 country or 20 — Deel is built for your situation. The EOR model eliminates the need to establish legal entities in each country, handles local employment law automatically, and gives your international employees the same quality of employment experience as your domestic team. Our full Deel review covers the complete global HR platform.
Choose Deel if international hiring is on your 12-month roadmap
Even if you’re US-only today, if your hiring plan includes international employees within the next year — whether for cost, talent access, or market expansion reasons — building on Deel now avoids a disruptive platform migration later. Switching payroll and HR platforms after you’ve already established processes and employee records is painful and costly. Start on Deel if global hiring is genuinely coming.
Choose Deel if you have a large international contractor workforce
For companies paying 5, 10, or 20+ international contractors across multiple countries — Deel’s contractor management platform handles locally compliant contracts, invoice management, multi-currency payments, and compliance monitoring in one place. The $49/month per contractor fee includes compliance infrastructure that would cost far more to replicate with a legal team and individual payment rails in each country.
Consider using both — many companies do
A common and sensible approach for companies with a mix of US employees and international workers is to use Gusto for US payroll and Deel for international EOR or contractor management. Gusto handles the domestic team affordably and seamlessly; Deel handles the international complexity. Both platforms are separate subscriptions, but many companies find the functional split cleaner than trying to run everything through a single platform that doesn’t do both equally well.
🏆 Final Verdict: Deel vs Gusto in 2026
This comparison doesn’t have a universal winner — and anyone who tells you it does hasn’t thought carefully about it. Gusto wins for US-focused businesses — it’s simpler, more affordable, better for US benefits, and built specifically for the domestic payroll challenges that US small businesses face every pay period. Deel wins for global teams — its EOR infrastructure, international compliance coverage, multi-currency payment capabilities, and immigration support are genuinely unmatched for companies hiring across borders. The decision comes down to one question: where is your team located, and where are you hiring next? Answer that honestly and the right platform becomes obvious.
🧡 Choose Gusto if:
- Your team is in the US and staying there
- You need affordable, simple US payroll automation
- US benefits (health, 401k) are a priority
- You want tight QuickBooks/Xero accounting integration
- You need to onboard US hires quickly
- Budget is a key constraint
🌍 Choose Deel if:
- You have employees outside the US
- International hiring is on your 12-month plan
- You manage international contractors across multiple countries
- You need immigration and visa support
- You need EOR without establishing foreign entities
- You want a free HRIS for your global team